The Rally vs. Traditional scoring debate in pickleball may have cooled off in recent weeks, but it is certainly not over.
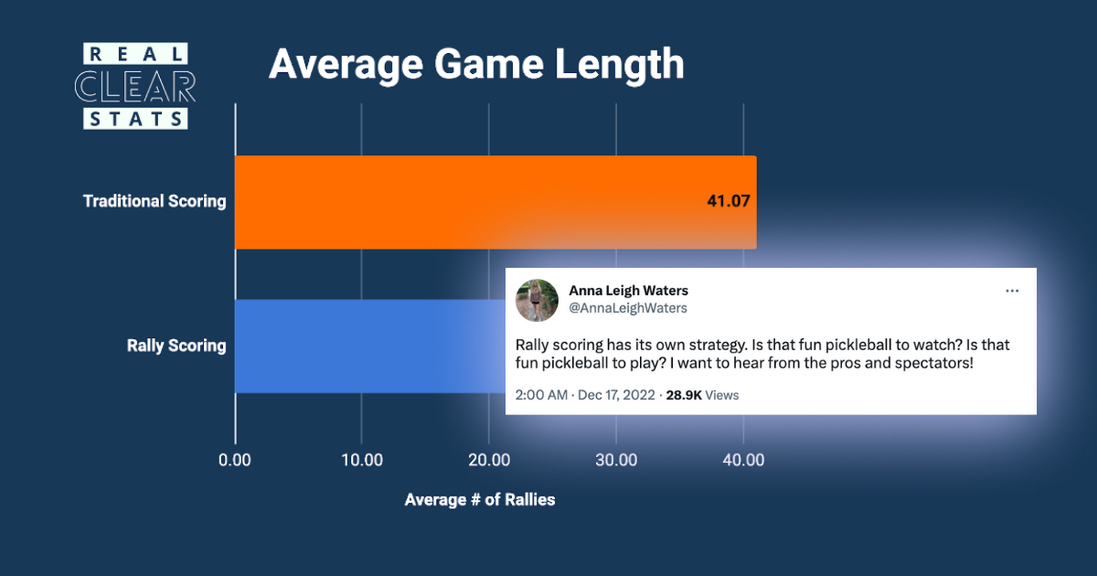
Late last year, Anna Leigh Waters—the #1 pick in this season’s Major League Pickleball draft—kicked off a public debate on Rally vs Traditional scoring.
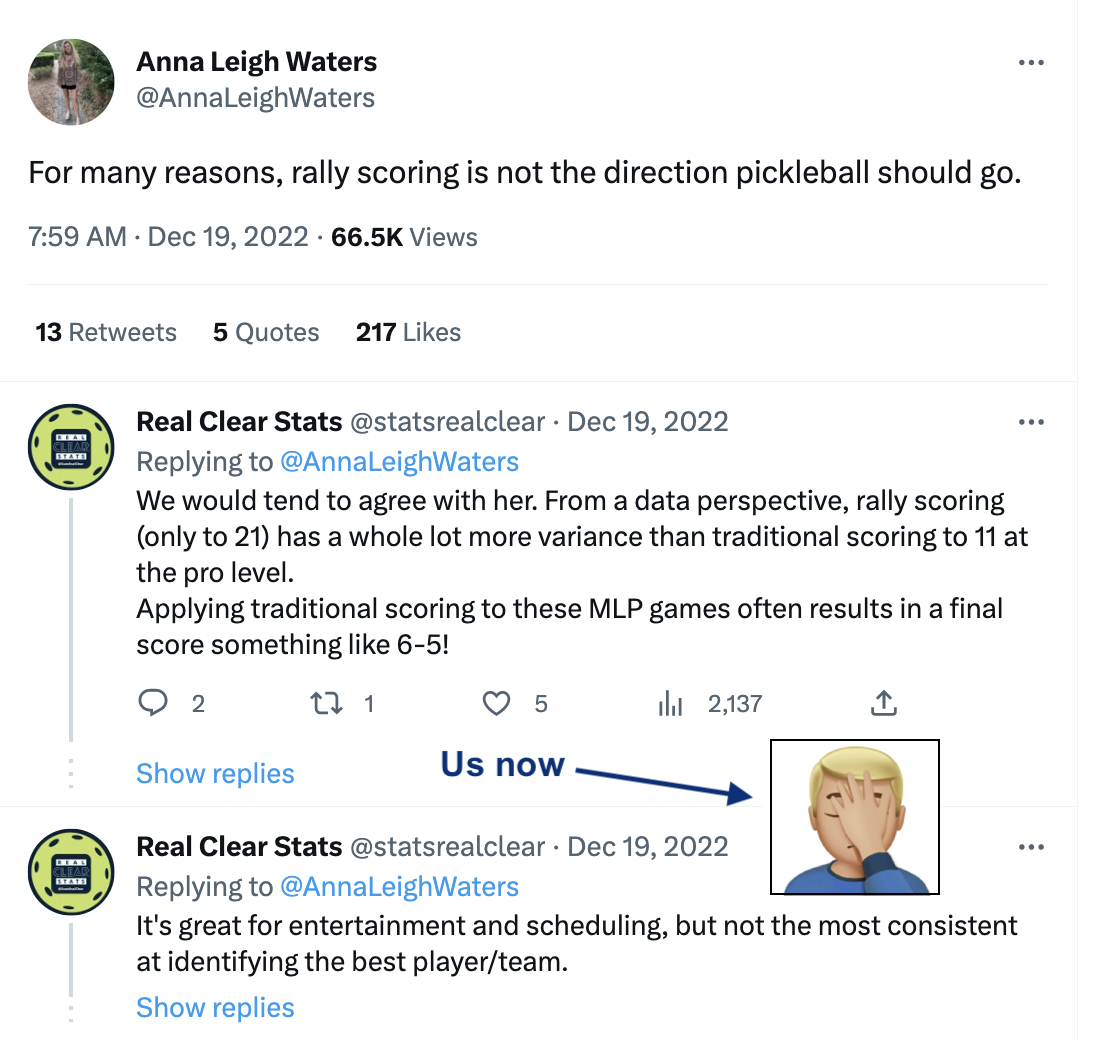
We gave some initial, off-the-cuff thoughts at the time in response relating to Rally Scoring’s perceived deficiencies in identifying the better team and affording trailing teams with a unique advantage.
For many reasons, rally scoring is not the direction pickleball should go.
— Anna Leigh Waters (@AnnaLeighWaters) December 19, 2022
On the surface, Traditional Scoring seems to be a much more reliable method of awarding the best team with the victory by honoring the unique set of skills required to win rallies while serving—hitting a quality third shot, arriving at the kitchen line, and winning the dink rally or firefight that ensues.
That's the essence of pickleball and why so many have favored Traditional Scoring for so long.
Enter Rally Scoring. Thanks to Major League Pickleball (MLP), Rally Scoring has been growing on the community. Yet it has struggled to gain adoption outside the Steve Kuhn empire. Why?
Likely plenty of reasons, but one of the biggest is the awarding of points on sideouts.
To many long-time pickleballers, this cheapens the importance of winning on-serve rallies and gives trailing teams a bit of an advantage once their opponents reach game point at 20.

Performance wear from Avi Athletics will instantly become your go-to pickleball gear. Save 20% with code THEDINK20.
Given the conventional wisdom and strong opinions on either side of the debate, we decided to dig into the data.
Here are some of the questions we sought to answer:
- Are Rally games to 21 longer or shorter than Traditional games to 11? And by how much?
- Are the durations of Rally Scoring games more consistent than Traditional Scoring games to 11?
- Does winning on-serve points become any less important with the introduction of points awarded on sideouts (pre-freeze)?
- When teams get to game point first, how often do they lose in the end?
- In Rally Scoring, how many on-serve points do winning teams typically score?
Before reading/scrolling any further, what do you think the answers to these questions will reveal?
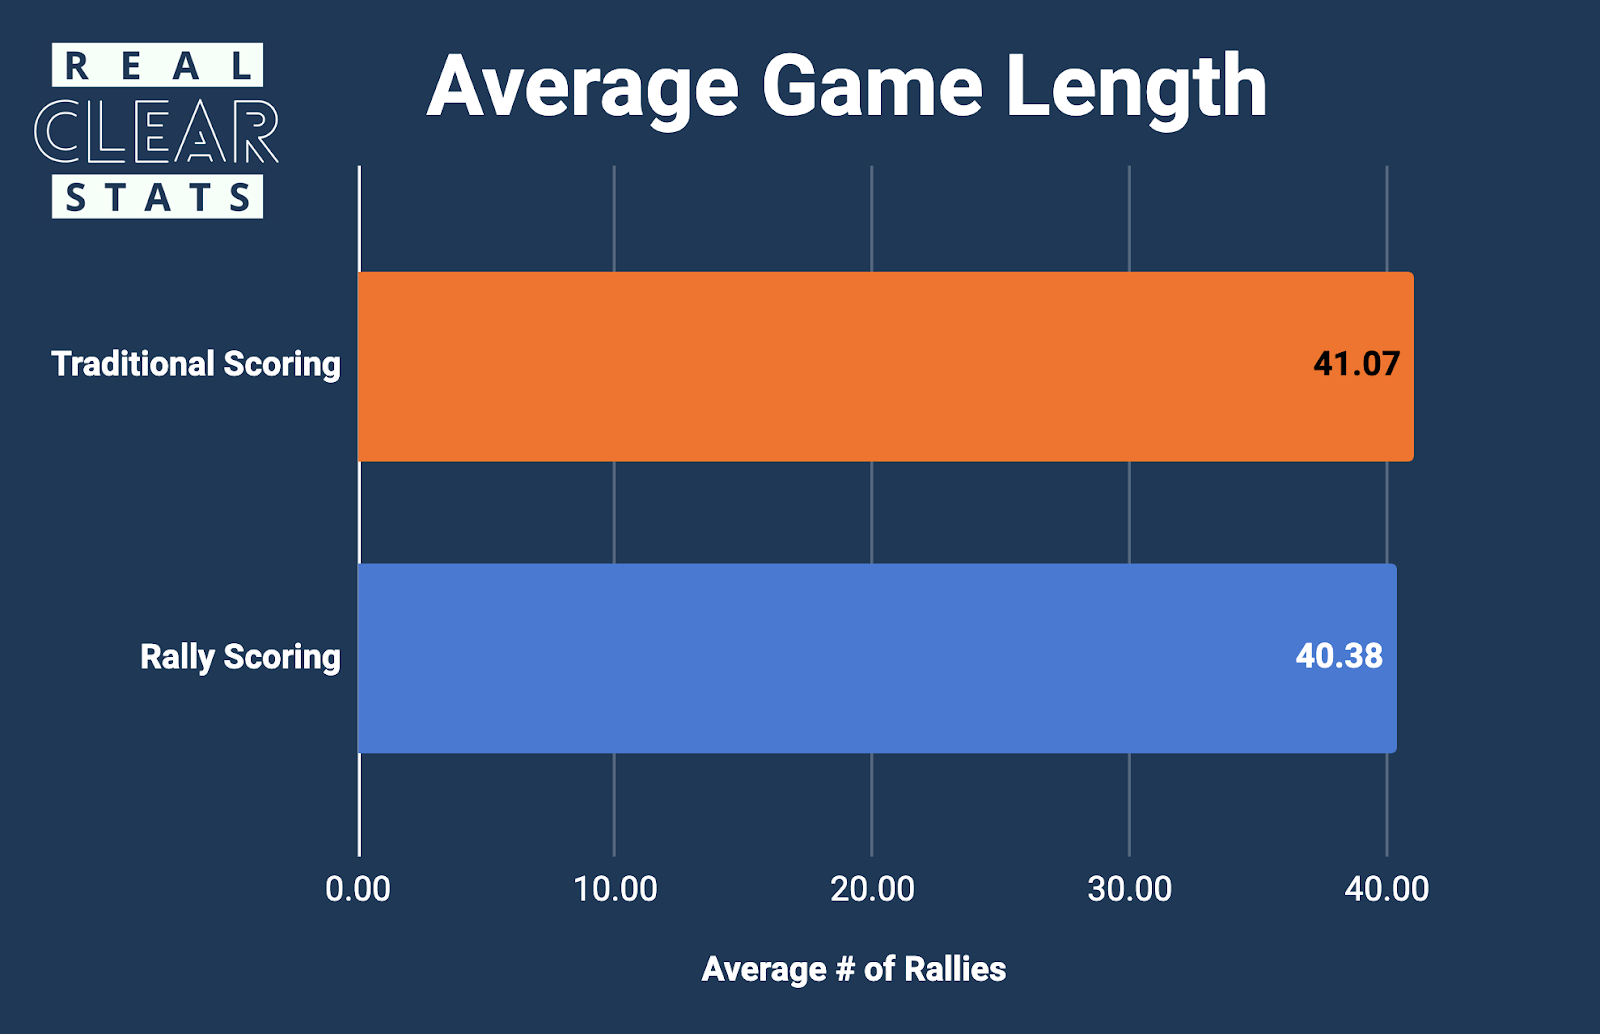
Average Game Length
It turns out that there is virtually no difference in average game length between Rally and Traditional scoring.
Both produce games of just over 40 rallies when played by top pros.
Looking at all 82 games from MLP Mesa Premier Level and comparing rally length averages to 76 Traditional pro doubles games (8 US Open games and 68 PPA games across 15 events and a mixture of WD/MD/MXD) reveals this unexpected discovery.
We had anticipated Traditional Scoring games to last on average much longer than Rally Scoring games, but this was a gross misconception.
Add to this the likelihood that most broadcast PPA games are more competitive than average (given how many first-round games go un-broadcasted), and we could logically expect the Traditional Scoring average to descend.
For all intents and purposes, based on these 158 games, there is no difference, on average, in the game length.
Game Length Consistency
Moving on to game-length consistency, Rally Scoring turns out to be significantly more consistent than Traditional.
Most of us would anticipate that game lengths would see less variance in Rally Scoring and at last, one of our hunches is validated. Traditional Scoring games were found to be 44.32% more volatile in terms of the standard deviation.
Special thanks here to Pklmart’s Alex Spancake who generously contributed time and data to make this detailed analysis possible thanks to all 46 of their PPA games on file—spanning 12 separate PPA events/venues.
The Rally Scoring data comes from 173 doubles games from MLP Columbus and MLP Mesa Premier Level meticulously tracked by Real Clear Stats.
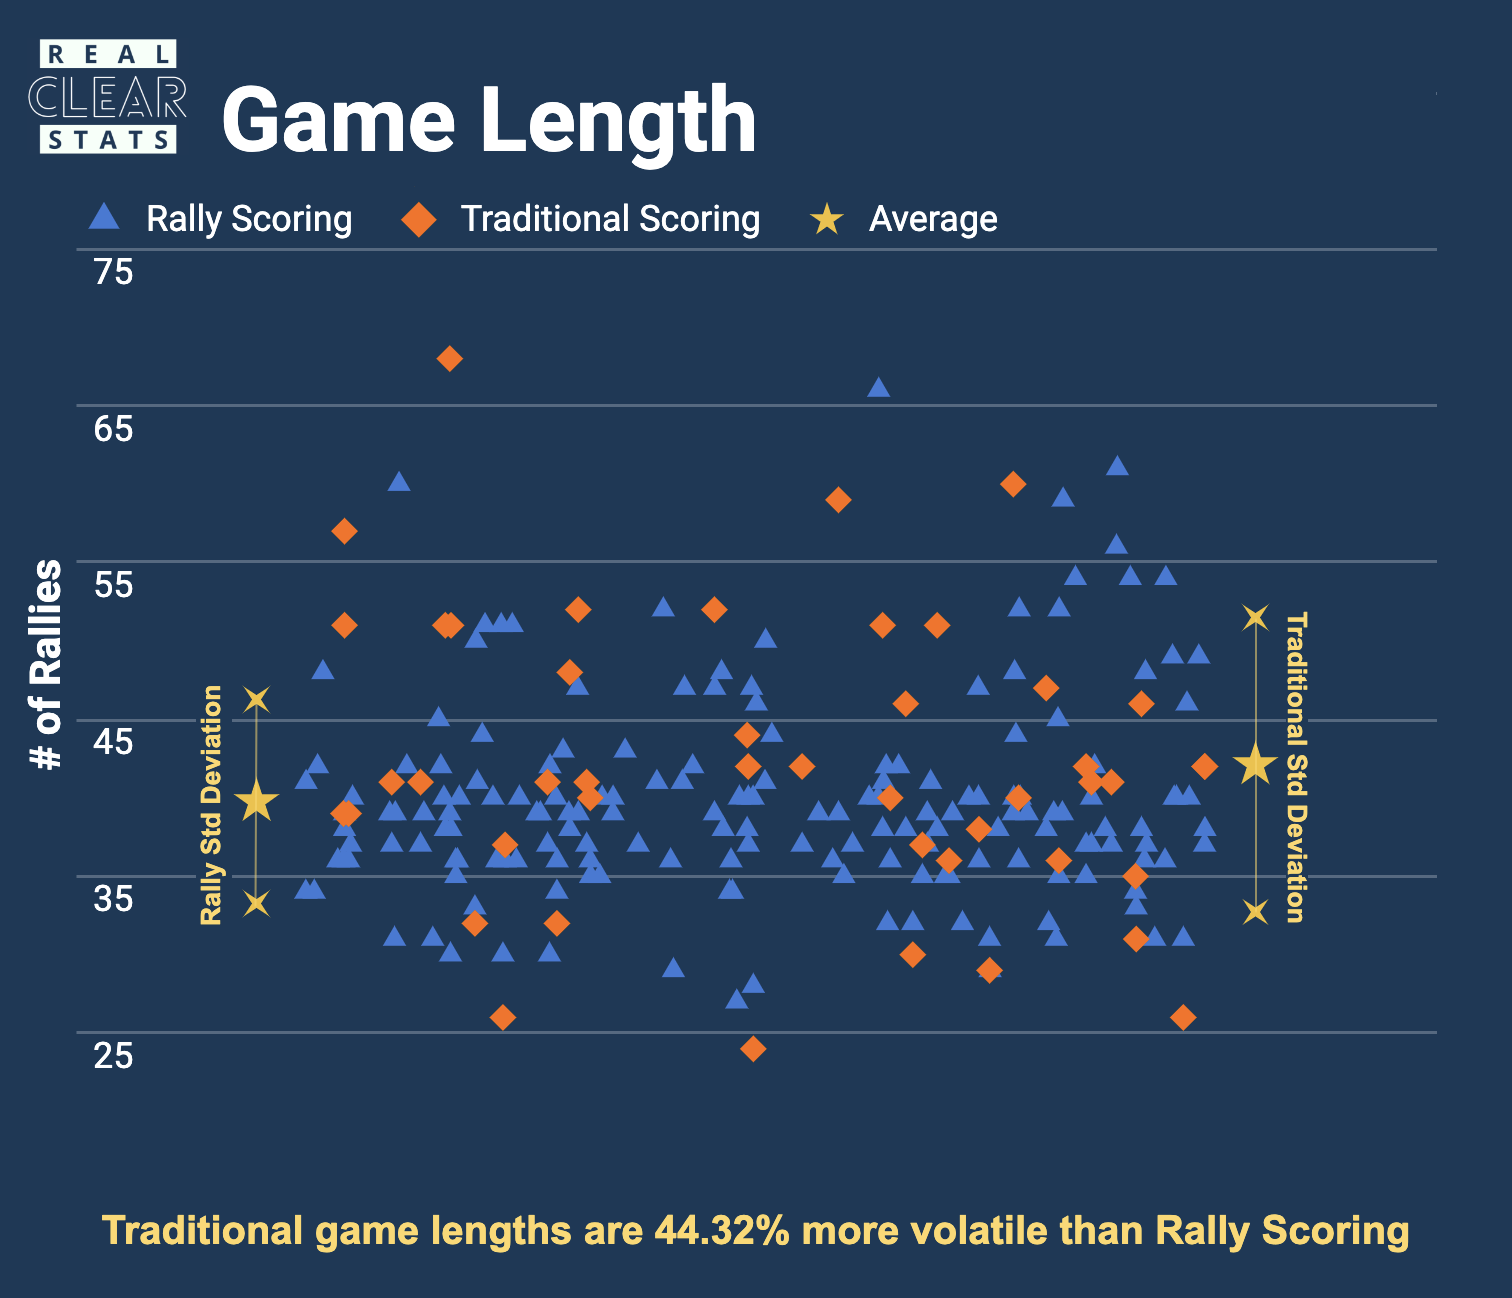
Beyond the clearly tighter distributions that you can see visually as well as when comparing the tightness of the standard deviations on each side, looking at the chart above, take note of the sea of blue triangles that lie between 35-45 rallies.
68.6% of rally scoring games fall within this range, compared to only 50% of the traditional scoring games.
Want more pickleball stories delivered straight to your inbox? Subscribe to the dink newsletter:
Late-Game Volatility
Anyone who watches MLP knows anything can happen. Teams you thought were unbeatable after the draft routinely go 1-2. Teams you thought couldn’t win go 3-0.
Is this caused by the Rally Scoring format—unpredictability due to post-freeze sideout scoring creating artificial drama?
Looking at the same 46 Traditional Scoring games and 173 MLP games from the scatter plot above, we make another stunning discovery.
The first team to achieve a game point is winning 91.30% of the time in Traditional Scoring games (42/46) and 91.33% of the time for Rally Scoring (158/173)—zero difference.

While we’re at it, let’s ask another question: In these MLP games, how often did a team win the game with fewer on-serve points than their opponents?
Never. Not a single time out of 173.
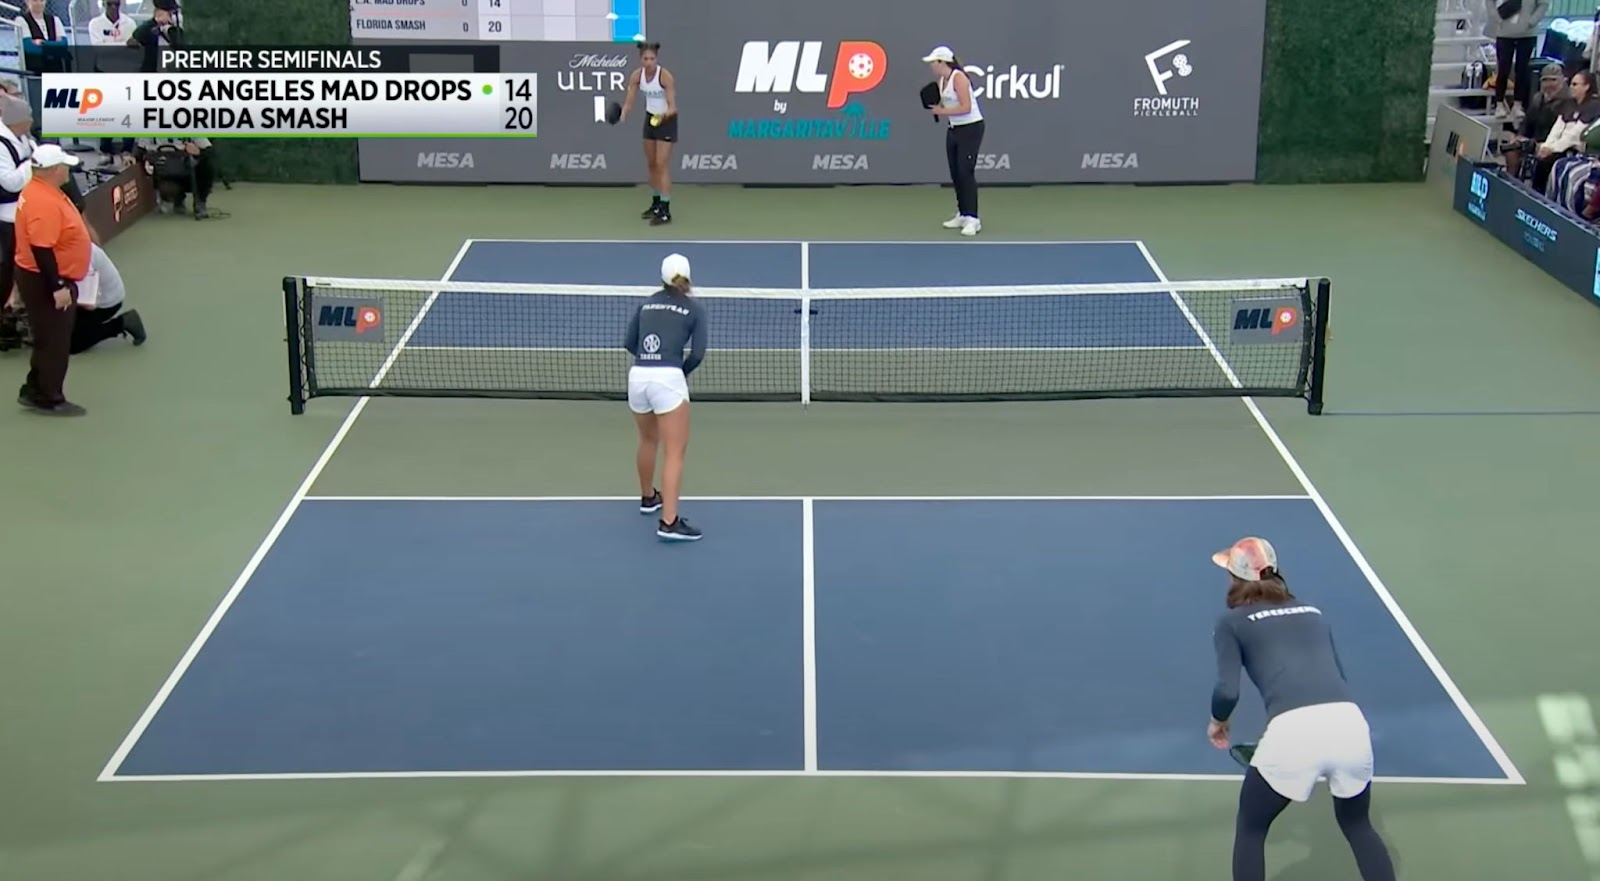
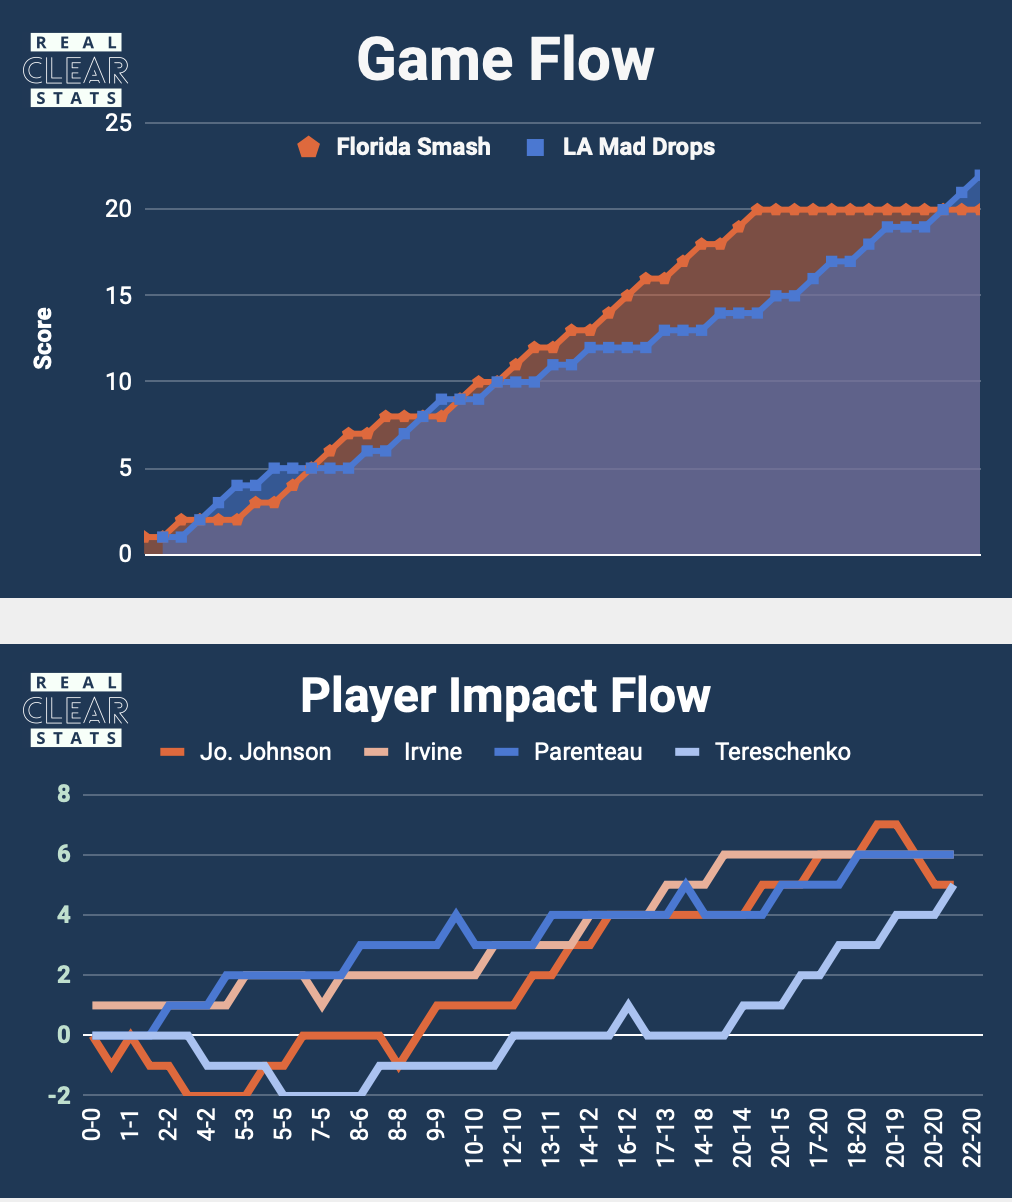
On just one occasion (0.6%), a team won with a tie in on-serve points (9-9): the MLP Mesa semifinal women’s doubles game between the Florida Smash and the LA Mad Drops.
Down 20-14, Parenteau/Tereschenko scored eight straight points to win 22-20 (three points on sideouts and five points on-serve).
Four other games at MLP Mesa Premier Level resulted in the victors only winning on-serve scoring by one (4.9%). This happened at MLP Columbus fourteen times (15.6%).
Combined, that’s 10.5% of rally-scoring games resulting in a winner that won on-serve scoring by just one.
Given the first team to game point wins 91.3% of games in both formats, it begs the question: Why then does it seem MLP events are riddled with surprising upsets?
Believe it or not, the upsets have almost nothing to do with the format. The main reason is that only one game is played instead of a best-of-three match.
Even the best teams routinely drop a game here or there on their way to the podium. Those losses are easy to ignore since those teams are very rarely losing best-of-three matches.

On-Serve Points Frequency
In addition to the chance to win by one, there are still plenty of legitimate differences between the two formats.
In rally scoring, sometimes games end up 8-5 in on-serve points, other times it’s 13-11, or 10-9. On average, how many on-serve points per game is Rally Scoring producing? How does this compare with Traditional Scoring?
Incredibly, both formats are producing essentially the same number of on-serve points.
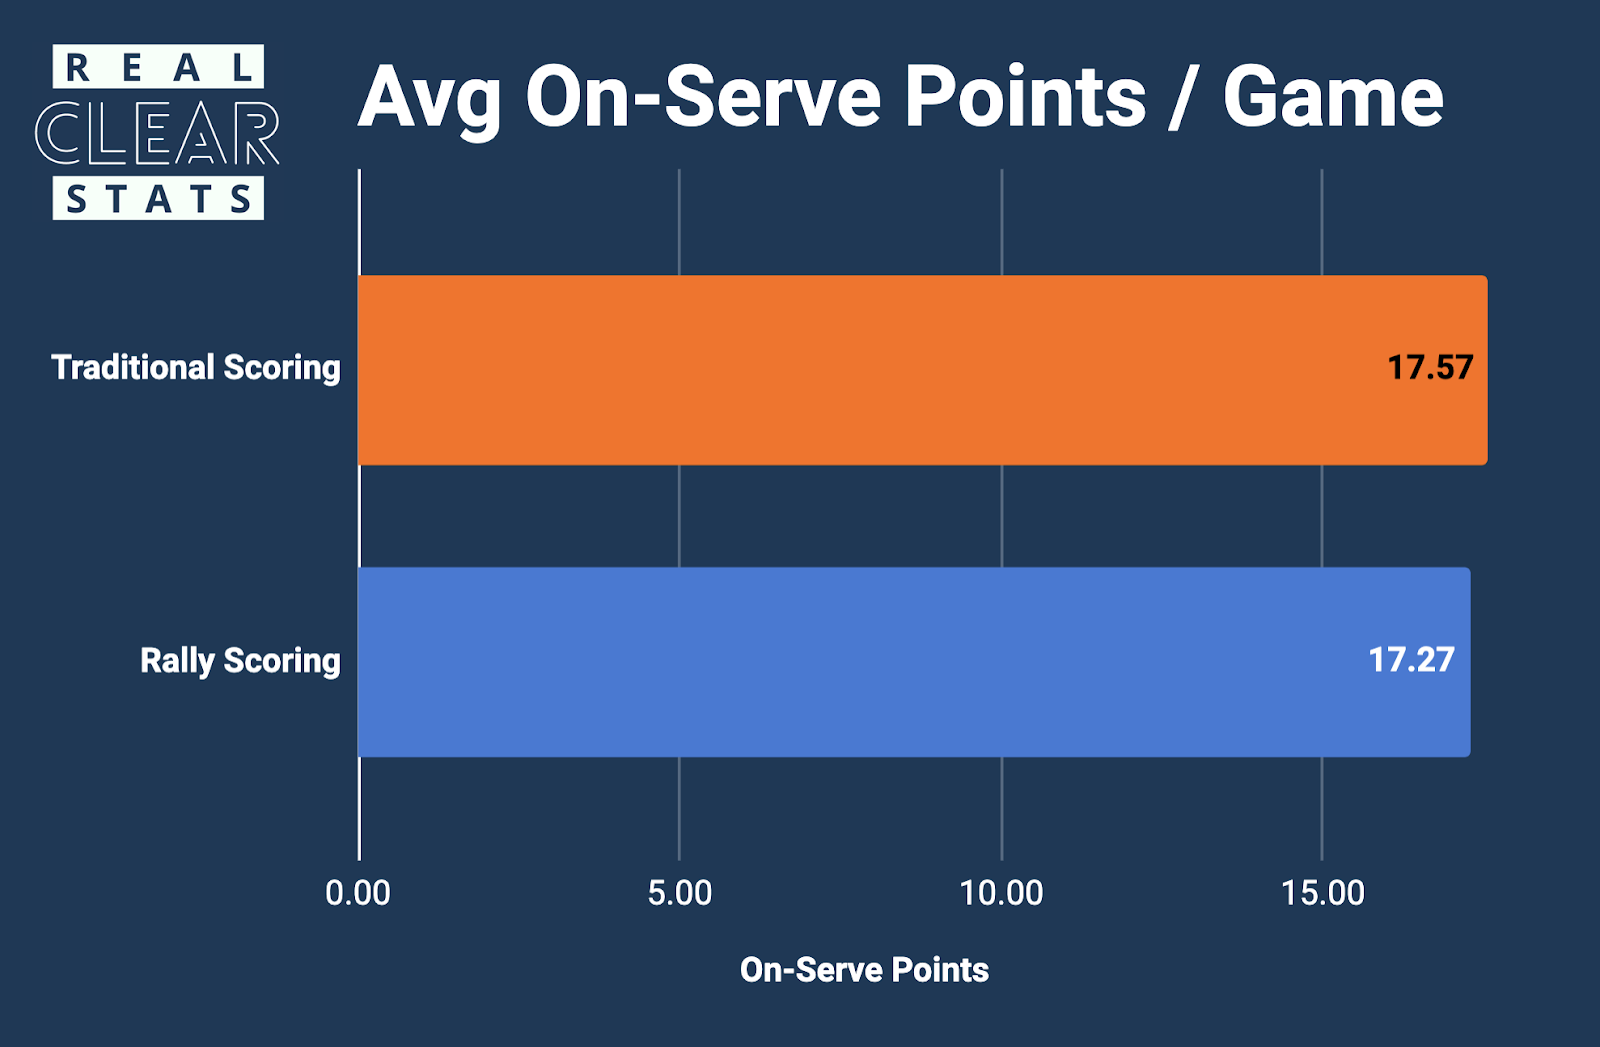
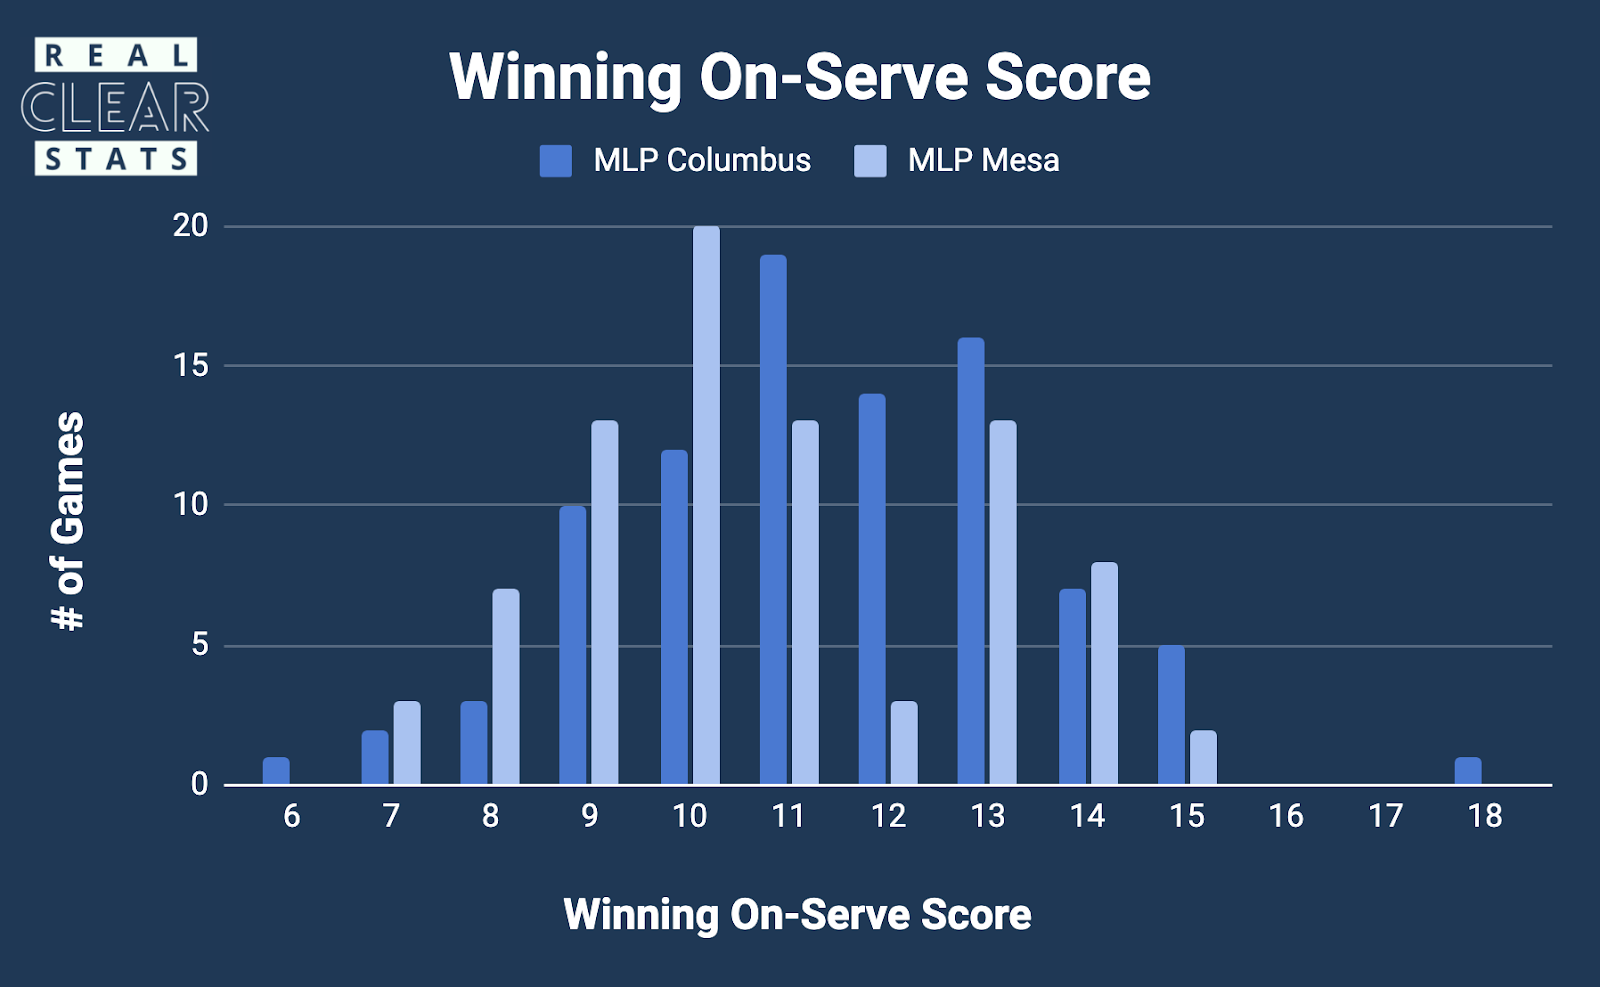
Moreover, the average on-serve score from our 173 MLP games is 10.7 for the winning team, and 6.1 for the losing team.
So on average, teams are still needing to score about 11 on-serve points to win.
Here’s a breakdown of the winning on-serve scores from MLP Columbus and Mesa Premier Level.
As you can see, the winning scores all congregate close to 11. In fact, 77.3% of the time the winning on-serve score is between 9 and 13.
Conclusions
Let’s put it all together. Here are the similarities and differences between these two scoring formats:
- Average Game length: The same—just over 40 rallies per game
- Game length consistency: 44.32% more volatility in Traditional Scoring
- First team to game point wins: No difference
- Winning team lost on-serve points: No difference
- Average number of on-serve points scored: Virtually no difference
- Average winning on-serve score of 11-ish for Rally Scoring
- Winning team wins on-serve points by two or more: 89.0% of games in Rally Scoring (154/173), 100% in Traditional Scoring
Achieving such striking similarities to Traditional Scoring with this level of predictability, while also removing the boredom of scoreless sideout streaks, amping up the sense of excitement and close games, without sacrificing the importance of winning points on-serve is impressive to say the least.
Gathering more data on both formats moving forward will be an important addition to this early work.
We can expect some slight shifts as paddle/ball technology change as well as gameplay styles at various levels, but even now we have enough information to confidently conclude that Rally Scoring is not a cheap substitute for Traditional Scoring—it is a legitimate alternative.
Given these findings, the virtues of Rally Scoring shine more brightly:
- Games of more predictable length
- No server number
- No stacking complication and confusion
- No long droughts without a change in the score
- Fewer missed appointments because your “one more” rec game took 45 minutes!
Now that we’ve looked at the data, re-reading our comments from last December is embarrassing.
Having scored hundreds of rally scoring games—many of them live, we thought our intuition and instinctual analysis would be fairly accurate.
We were wrong.
This is just one example of why it’s time for Pickleball to embrace data. We need to afford ourselves the intellectual curiosity required to ask questions to which we think we know the answers.
The sooner we ask these questions and learn the truth, the better off we’ll all be in the long run.
Read Next: Is Your Pickleball Serve Legal? | The Definitive Guide
Our analysis was so surprising to us, that though originally intending to remain neutral, given the strength and clarity of the data, the facts now make neutrality an uncomfortable position.
Given the benefits—especially for pro and amateur tournaments—how could we as the pickleball community, tournament organizers, and pro tours not at least attempt to use rally scoring more often?
———————————
For more analysis from Real Clear Stats and to keep tabs on our quest to elevate Pickleball at every level with accurate, comprehensive, live stats—as well as data-driven analytics, follow us on Instagram (@RealClearStats) or Twitter (@StatsRealClear). Also see our Substack to subscribe to this and future posts.
Special thanks again to Pklmart’s Alex Spancake for his generosity in digging into and sharing Traditional Scoring data from 46 PPA games across 12 separate PPA events. Also notable is Jim Ramsey’s work in this article from last year where we were able to glean some helpful data for the average game length analysis.

Guest Author
Love Pickleball? Join 100k+ readers for free weekly tips, news & gear deals.
Subscribe to The Dink